Automation of Linhares Thermal Power Plant’s Substation with Elipse Power
This case presents an Elipse Power-based application for controlling a power plant substation in Linhares, a town in the eastern region of Brazil

Needs
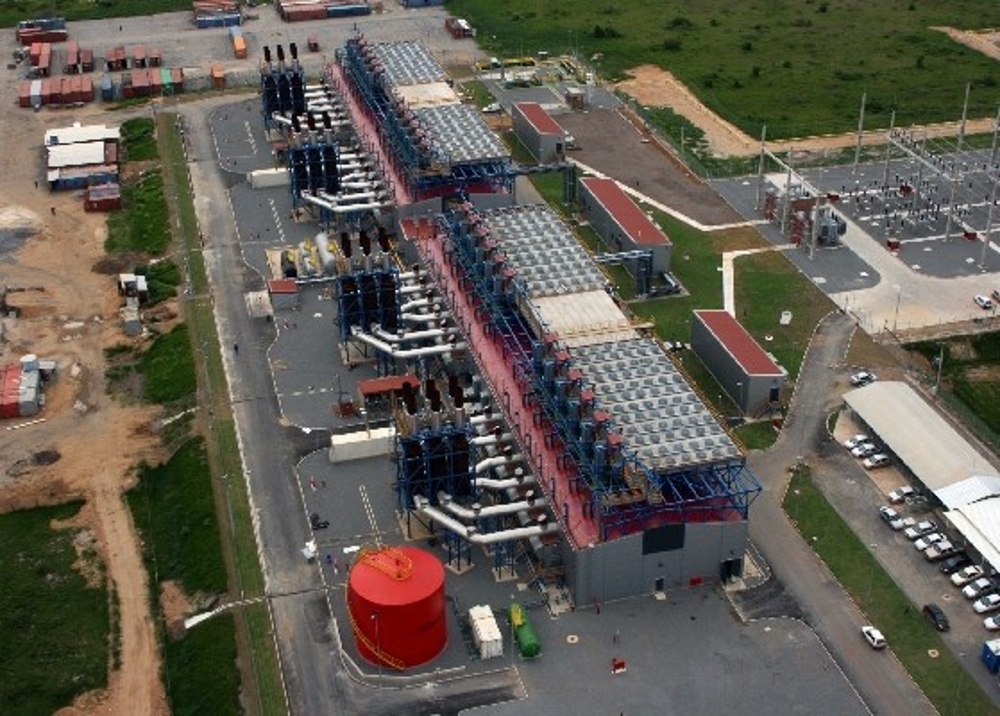
Opened on December 23, 2010, the Linhares Generation’s Thermal Power Plant, located in Linhares (ES), was designed to generate around 75 jobs, 80% of which will work directly at the power plant, according to company’s management. Altogether, around U$ 230 million were invested to build the plant, the first one running on liquefied natural gas (LNG) in Brazil. The thermal power plant can produce up to 204 MW, which is enough to supply power to 400,000 homes.
To better control the operation of the plant’s substation, the Elipse Power, a software solution developed by Elipse Software, was adopted in this project. With Elipse Power, operators can monitor and perform commands on circuit breakers, switches, transformers, and other substation devices. To implement this solution, WEG CNS provided the substation to Linhares Generation. As for installing the monitoring system, protection and control, WEG hired SEL – Schweitzer Engineering Laboratories, and they, in turn, hired Energy Automation.
Solution
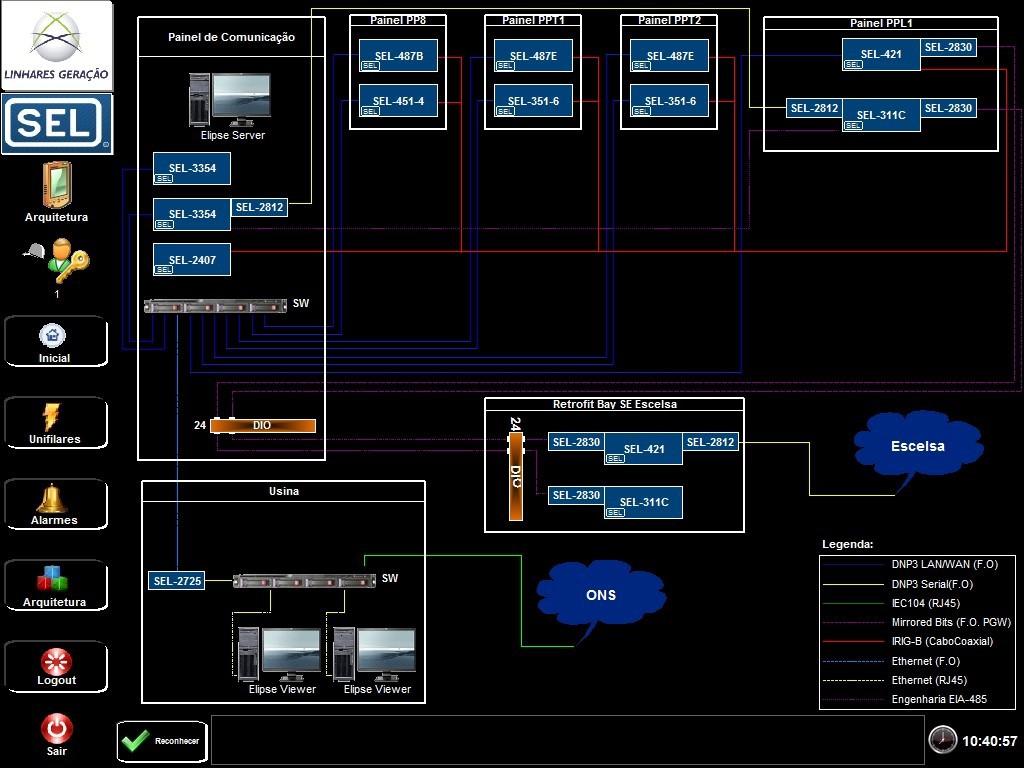
Since December 2010, Elipse Power has been running locally at the substation on a SEL dedicated computer (SEL-3354 model), which has an HMI that offers local operation via a 15-inch touch screen. In addition, the substation can be operated by two islands, installed in the plant’s control room. The HMI exchanges information with the substation’s devices communicating with another SEL dedicated computer (also SEL-3354 model), called the “hub”, via DNP 3.0 protocol.
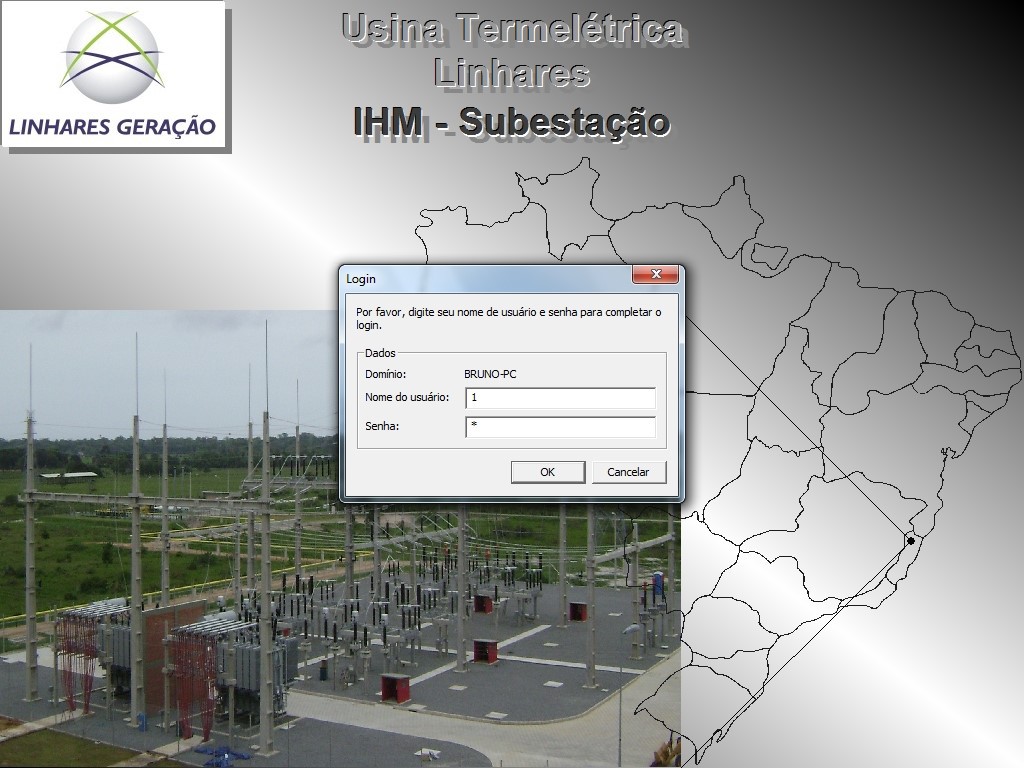
Through a series of screens, operators can monitor anything, from the system’s architecture to different variables and measurements taken by the substation’s devices. To do so, the user must click once on Elipse Power’s Home screen, which will enable the fields for typing their login and password to access the application.
On this screen, Linhares Thermal Power Plant is represented by a small black dot indicated on the map of Brazil. If the software’s alarm system detects any kind of failure in one of the units that make up the substation, the black dot flashes in red.
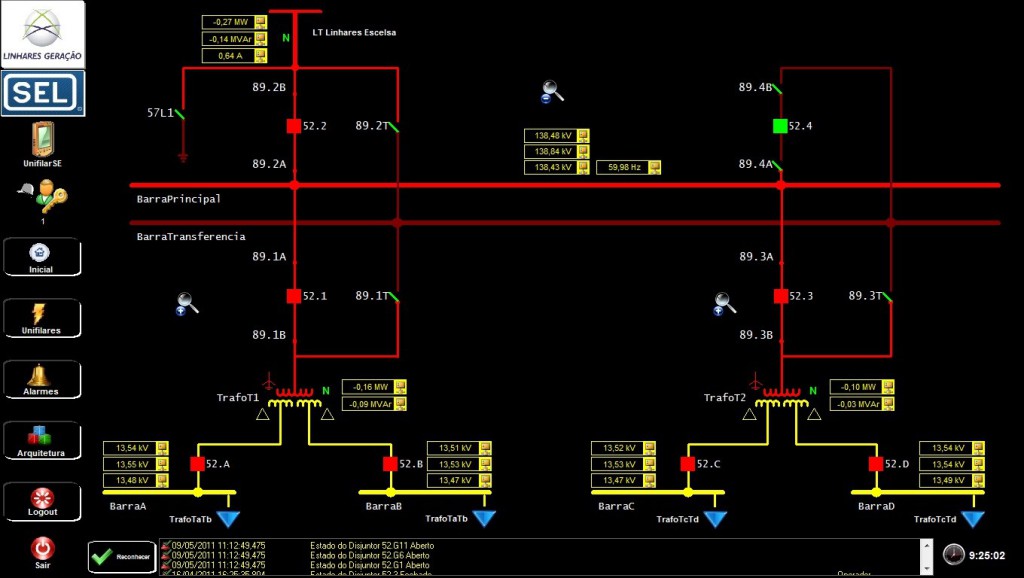
After inputting login and password, the user accesses a table with three different fields. On the left, there are illustrated icons for direct access to the initial screens, single-line diagrams, alarm summary, and system architecture. At the bottom, you can see all the details about the most recent events noted by Elipse Power (what the problem is, and where it was noted; date, time, and name of the operator responsible for acknowledging it). Finally, at the center, there is the substation’s general synoptic.
Alarms System
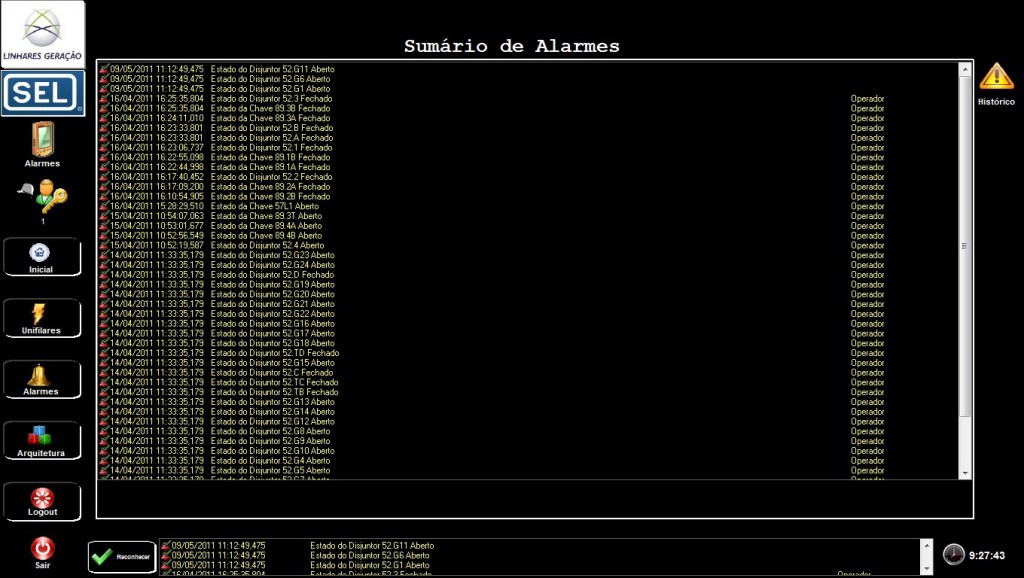
When clicking the icon Alarms, on the left of the frame, the user has access to the Alarm Summary screen. On it, it is possible to follow the details regarding the events being noted in real time by Elipse Power (what the problem is, and where it was noted; date, time, and name of the operator responsible for acknowledging it).
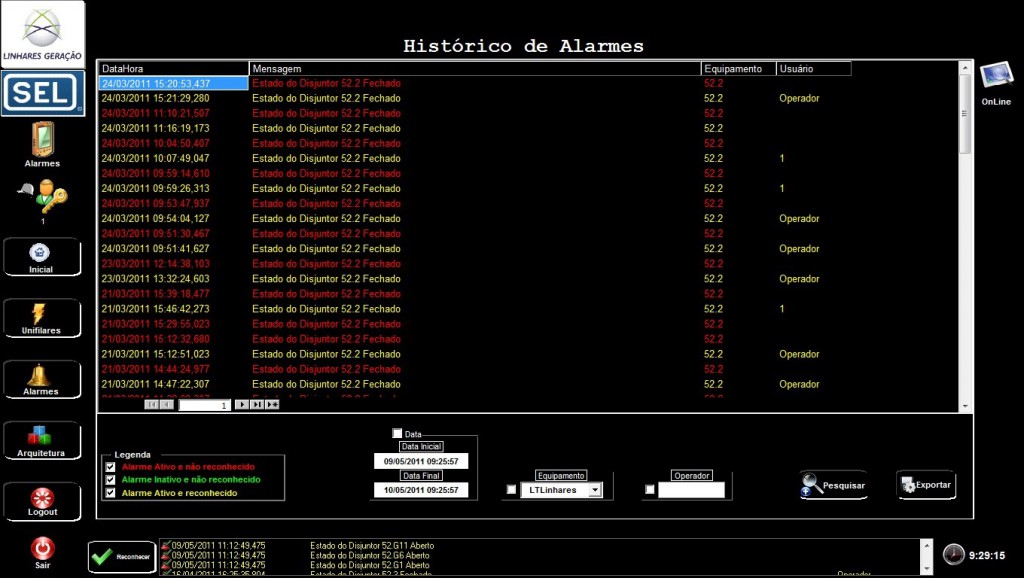
By clicking on the yellow icon located on the upper right corner of the Alarms Summary, you can access the alarm history. In it, the user can view information about all past occurrences that have reached the substation, which enable them to decide the time interval, device, operator, and alarm status (active, inactive, or acknowledged) to be monitored.
To do so, just put initial and final dates and time, and check the corresponding checkboxes on the screen, so that Elipse Power can collect and display all alarms recorded during this period. After the filter has been set, you can also export an alarms report in PDF format.
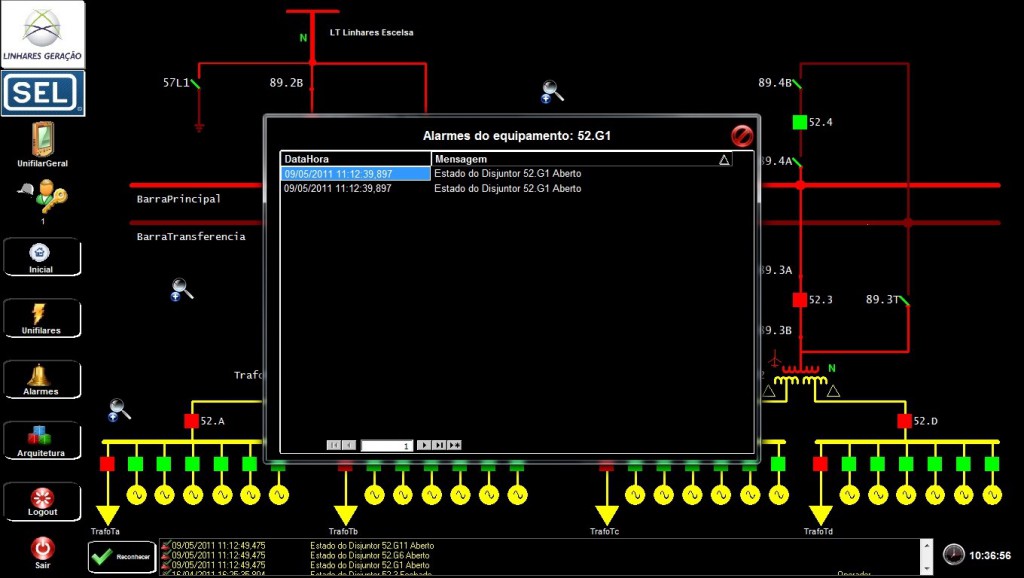
In addition to these two screens, the user can click the icon standing for a circuit breaker on the screen, for example, and access only the events that occur on the selected device. Thus, it is possible to save time in the substation control, since the user no longer needs to search among all instances displayed in the Alarm History.
Options Menu
In addition to monitoring the incidents recorded on each substation’s device, Elipse Power can also follow digital and analog measurements, perform commands, and visualize charts and interlocks. To do so, just click the icon standing for a processor, for example, to have access to voltage and current measurements, as well as to reset the lockout relay and protection transfer, among other commands.
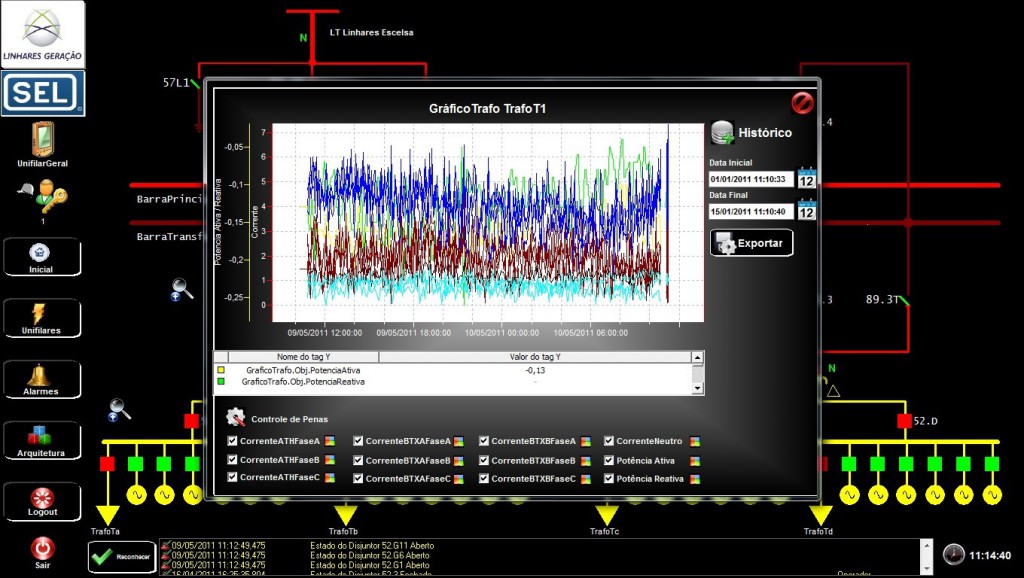
The option Chart allows the user to monitor analog values (currents, voltage, frequency, and active and reactive power) of devices displaying these variables, via two charts. The online chart allows the user to view, in real time, all variations in currents picked up by a processor, for example.
The historic chart, on the other hand, shows the variations captured in the past. To do so, simply specify the start and end dates to be supervised, and display them on the screen in graphical form. In addition, the user can export the values of the monitored period, as well as the curve shown in the chart, in a PDF report.
Either operation (online or historical) allows the user to choose which pens to monitor, or even change their colors. Finally, by clicking the option Interlocks, the user can monitor conditions that prevent a given command to act on one of the substation’s device. This blockage could be caused by an issue defined by the substation’s rules.
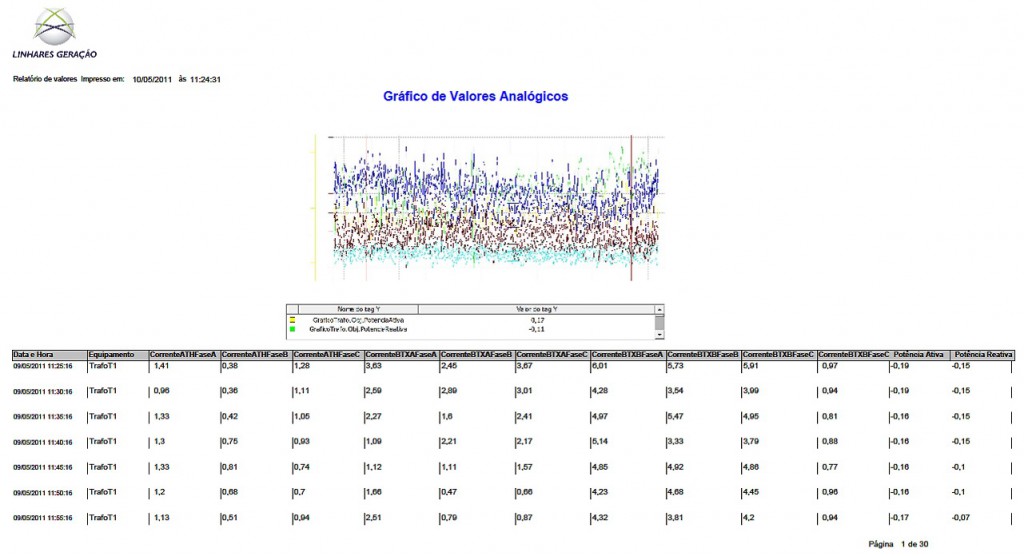
Figure 9. Report showing the chart’s information regarding historical measurements indicated on TrafoT1 transformer
Single-line Diagrams
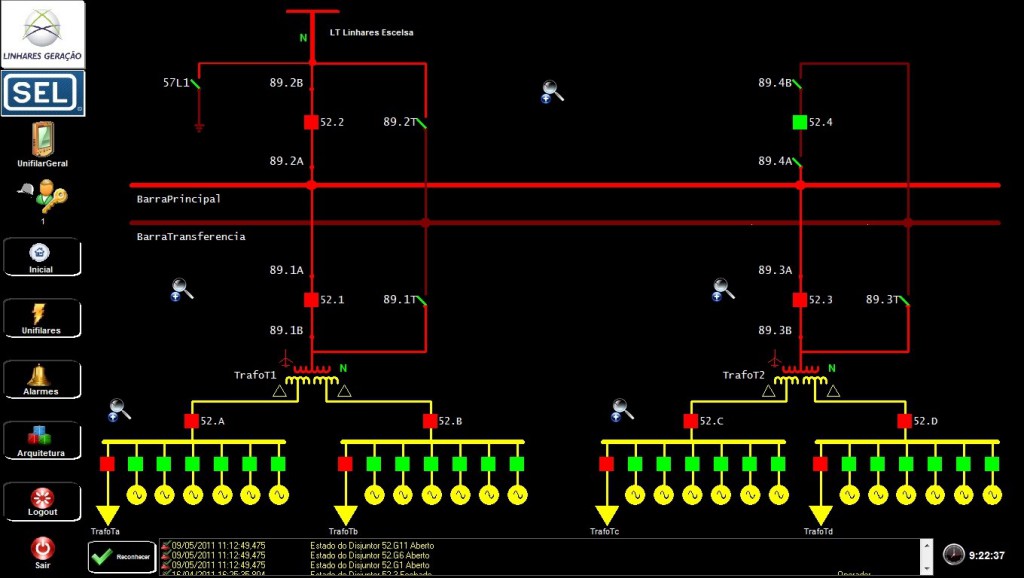
By clicking on Single-Line Diagrams, on the left of the screen, the user opens a menu for accessing all views of the substation’s single-line diagrams (six of them altogether). A single-line diagram is nothing more than the simplified representation of an electrical system, aiming at revealing the interconnections between devices involved in generating and transmitting energy.
In addition to the general single-line screen, there are five others that show in detail certain parts of the whole single-line diagram. On each one of these, the user can zoom on any of its parts with the magnifying glass icons on the screens.
Benefits
- Access control to the application via login and password on Elipse Power’s home screen.
- Fast and accurate visualization of all the devices comprising the control system’s architecture of Linhares thermal power plant’s substation.
- Graphical display of the different variables involved in power generation and transmission.
- Detailed information about historical and current events, in real time, checked by the software’s alarm system with the substation.
- Ability to perform commands on each of the substation’s devices (switches, circuit breakers, sectionalizers, etc.).
- Monitoring the substation’s single-line diagram in real time.
- Following (in details) all the parts comprising the single-line diagram, with zoom-level accuracy.
Datasheet
Client: Linhares Geração
Systems Integrator: Energia Automação
Software: Elipse Power
Number of copies: 1
Platforms: Windows XP and Windows 7
Number of I/O points: 374
I/O Driver: DNP 3.0
